Question 231 · 365 in bank
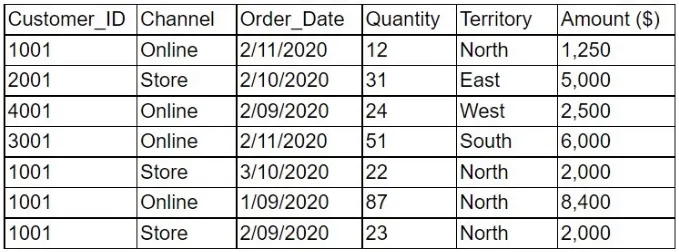
A reporting analyst is creating a dashboard that shows the year-over-year performance for a sales organization. Which of the following is the best visual for the analyst use to illustrate the organization's performance?
Show answer
Answer: D